Why One Number Moves Markets: Making Sense of EPS
What Nvidia’s EPS tells investors now
Earnings Made the News—But What Do They Mean?
You’ve probably seen it splashed across your feed: “Nvidia smashes earnings.”
But if you looked closer at the numbers—revenue up, net income soaring, and EPS all over the headlines—you may have found yourself wondering: what exactly is EPS, and why does it matter so much?
This week’s earnings season spotlight offers a perfect opportunity to unpack that.
With Nvidia’s latest results and key economic data on the horizon, it’s the ideal moment to break down one of the most talked-about numbers in finance—and how to actually use it.
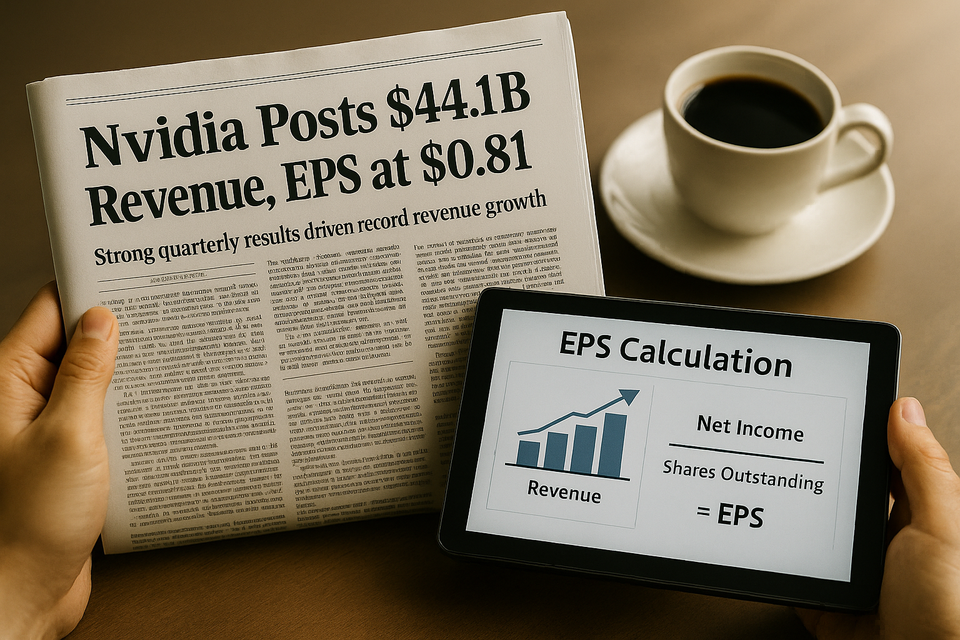
Nvidia’s Knockout Quarter, and What Comes Next
Let’s start with the biggest name in the room.
Nvidia reported one of the most impressive quarters in recent memory on May 29, and the numbers were hard to ignore:
- Revenue: $44.1 billion—up 69% year over year
- Net income: $18.8 billion—up 26% from the same period last year
- GAAP EPS: $0.76
- Non-GAAP EPS: $0.81
- Adjusted EPS (excluding inventory charges): $0.96
Even with a $4.5 billion charge tied to unsellable H20 chips due to U.S. export restrictions, Nvidia managed to post record-breaking results. Shares climbed 4.9% in after-hours trading, as investors focused on surging demand for AI infrastructure, particularly in data centers—which alone drove over $39 billion in revenue.
But while individual earnings reports draw headlines, smart investors know that bigger forces also shape the market mood.
At the same time, Wall Street is gearing up for another critical data point: the May U.S. jobs report (due June 7). Analysts expect job creation to slow to around 130,000—a sign the economy is cooling without crashing. This matters for EPS too.
Why? Because slowing jobs growth can mean lower wage pressure, easing inflation, and potentially higher corporate earnings ahead.
Investors are watching not just what companies report—but what economic signals are telling them about future profits per share.
What EPS Really Tells You (and What It Doesn’t)
So why is EPS front and center during earnings season?
Because it’s the shorthand Wall Street uses to compare profitability across companies. But that doesn’t mean it tells the whole story.
EPS—short for earnings per share—is a simple formula: net income divided by shares outstanding. It tells you how much profit is attributed to each share you own.
That simplicity is part of its appeal. It’s used in headline comparisons, in price-to-earnings (P/E) ratios, and in setting expectations across industries.
But like most single metrics, it has its limits.
For example, companies can boost EPS not just by increasing profits—but by shrinking the number of shares through buybacks. One-time gains or losses, like Nvidia’s chip-related write-down, can distort the number. And EPS says nothing about the health of a company’s balance sheet or its ability to generate free cash.
Bottom line: EPS is helpful, but only when you understand the story behind the number.
Why EPS Can Move a Stock—or Leave It Flat
This brings us back to Nvidia.
You’d think a 69% jump in revenue and nearly $19 billion in net income would launch the stock into orbit.
Instead, the market’s reaction was… solid, but not spectacular.
That’s because earnings aren’t judged in a vacuum—they’re judged against expectations. And when expectations are already sky-high, even a great report might only confirm what’s already priced in.
This is where EPS becomes more than a math exercise. Investors want to know: Was this quarter truly exceptional? Was it sustainable? Or did the company just meet lofty forecasts?
At the same time, macro signals like job growth and inflation pressures tell investors whether future quarters might support or strain earnings.
If costs are rising and demand is slowing, even strong companies may see margins squeezed.
That’s why savvy investors use EPS not as the final answer, but as a leading clue.
How to Actually Use EPS in Your Strategy
So what should you do the next time you see a company report strong EPS?
Instead of reacting to the number alone, take a moment to dig deeper. Here are some smart ways to put EPS in context:
- Go beyond the headline
Look into what drove the earnings figure. Was it operational strength—or creative accounting? - Compare across time, not just companies
A single number isn’t useful unless you know the trend. Has EPS been rising steadily—or is this quarter a blip? - Check if expectations were met—or missed
Stocks often jump or fall not on the actual EPS, but on how it stacks up against forecasts. - Don’t confuse share buybacks with growth
If EPS improved mainly because the company repurchased shares, ask whether real business momentum is there. - Use EPS to screen, not decide
It’s a great filtering tool, but not a substitute for reviewing cash flows, margins, and balance sheet health.
What’s Your Take?
Do you use EPS as part of your investing playbook—or skip it altogether?
Have you ever chased a headline earnings beat—only to see the stock fall the next day?
These moments highlight the importance of seeing numbers in context. Because once you understand the “why” behind the figure, EPS stops being noise—and starts being useful.
Invest With Clarity, Not Complexity
EPS is one of the market’s most-watched numbers for a reason. It distills a company’s bottom line into a digestible format. But that doesn’t mean it should be taken at face value.
When you learn to read beyond the headline, you gain a clearer sense of what the market values—and how to position your own portfolio more effectively.
So next time earnings season rolls around, don’t just ask, “What was EPS?” Ask, “What drove it? What’s next? And what does it really tell me?”
Because investing isn’t just about reacting to results. It’s about interpreting signals—and making smarter decisions from them.
Strategies Worth Watching
Why Are Others Winning While You’re Stuck?

If you've ever looked at someone else's portfolio and thought, “What am I missing?”—this one's for you.
Too often, the difference between slow gains and strong performance isn’t luck. It’s clarity.
And this 8-minute video breaks down why so many investors struggle to get ahead—and what to do instead.
Here’s what you’ll learn:
- The silent killers of performance most investors overlook
- Buffett’s #1 rule—and how to apply it beyond the cliché
- Four essential metrics that show how well your portfolio is really doing
- How to benchmark your returns the way pros do it
You don’t need to trade faster or follow more news. You need to measure smarter, and invest with purpose.
👉 Watch the video now and see what most investors never get taught—but desperately need to know.
P.S. Like what you see? This video is just the beginning. Join the Superinvestors' Club for a free 2-week trial and start building a portfolio with conviction.
More Tools for Your Journey
Let’s face it—no one enjoys the thought of losing money.

Whether you're new to investing or burned from a bad trade, fear can paralyze your decision-making. But the antidote isn’t avoiding the market—it’s understanding it.
That’s where smart, well-written investment newsletters come in. They give you the tools to see risk clearly, not emotionally.
With each issue, you’ll gain insights into how real investors think about losses, diversification, and long-term strategy—so you can act with confidence instead of fear.
👉 Explore my recommended list here and start building the kind of knowledge that protects your money—and grows it.